

Rethinking Corporate Lifecycle
Why the classic corporate life cycle framework misses the mark.

For as long as I’ve worked in finance and investing, the concept of a corporate life cycle has been one of those ideas that just makes sense. Companies, like living organisms, are born, grow, mature, and eventually decline. It’s a framework you’ll find in business school textbooks, boardroom strategy decks, consulting deliverables, and investment memos. And like many well-worn narratives, it survives because it feels intuitively right. If you forget what I meant by a corporate life cycle concept, let me share the picture below.

But recently, I came across some research by Michael J. Mauboussin and Dan Callahan, CFA, titled Charts from the Vault (you can download the report through the link below). This research challenged my assumptions about how companies actually move through these stages and, more importantly, how we should measure where they are in their journey. In the report, the discussion about the corporate lifecycle is only briefly explained by both writers, but it left a deep internal debate within myself. What started as a casual review turned into one of the more thought-provoking exercises I’ve done this year.
https://www.morganstanley.com/im/publication/insights/articles/article_chartsfromthevaultpicturestoponder.pdf
The Classic Story: Neat, Logical, but Potentially Misleading
The traditional corporate life cycle theory suggests that companies start off generating poor returns on invested capital (ROIC) because they’re pouring resources into product development, market entry, and early scaling. You can imagine this phase as a startup trying to prove its hypothesis of the market and burning cash left and right, trying to get into the product-market fit (PMF).
As they grow, economies of scale, operational leverage, and competitive advantages kick in, pushing ROIC well above the cost of capital. Then, as markets saturate and competitive pressures mount, those returns gradually erode, driving ROIC back toward the firm’s weighted average cost of capital (WACC).
It’s a tidy, logical progression. And if you’re like me, you probably believed it implicitly.
But when Mauboussin and Callahan from Counterpoint Global tested this idea using real-world data, tracking the median ROIC-WACC spread for U.S. public companies from the year of their IPO through 15 years post-listing, the results didn’t line up the way I expected.
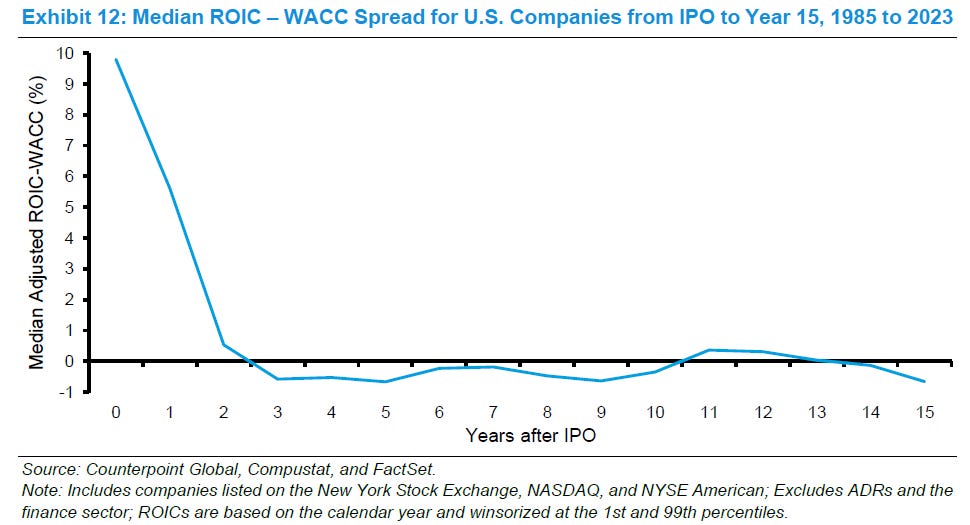
At the time of an initial public offering (IPO), when firms are usually younger than the majority of public companies, the median ROIC-to-WACC spread is actually significant and gradually declines until it stabilizes around the third year.
Both writers suggest that one reasonable explanation for this result is that companies are not entirely new, considering their founding year as their start date when they go public. On average, the median age of these companies at the time of their IPO was around 10 years during this period, while the median age of all public companies stands at approximately 25 years. This empirical trend does not align with the typical life cycle narrative.
The Data Tells a Different Story
If the classic life cycle narrative held, we’d expect to see low ROIC-WACC spreads in the early years of public life, rising over time as firms scaled, then falling as they aged. Instead, the data showed that most companies had high spreads at the time of their IPO. Those spreads actually declined over the first three years before stabilizing.
At first glance, this felt counterintuitive. However, a closer look revealed something important: companies going public aren’t usually young in the literal sense. The median age of firms at IPO was about 10 years, compared to 25 for the average public company. Many of the most capital-intensive, loss-making years happen while these businesses are still private. By the time they list, they’ve often already proven out their economics.
The key takeaway? Age isn’t a reliable proxy for life cycle stage.
A Better Way to Think About Life Cycles
That realization led me to a fascinating alternative proposed by Victoria Dickinson, who built a classification system based on cash flow patterns. Instead of guessing a company’s stage based on its age or IPO timing, she looked at operating, investing, and financing cash flows — inflows and outflows — to dynamically assign firms to different stages.
When Counterpoint Global applied a version of this dynamic life cycle analysis to U.S. public companies from 1985 to 2023, the results were striking. This time, the familiar ROIC curve showed up exactly as the theory predicted.
Check out Exhibit 13 from their analysis:
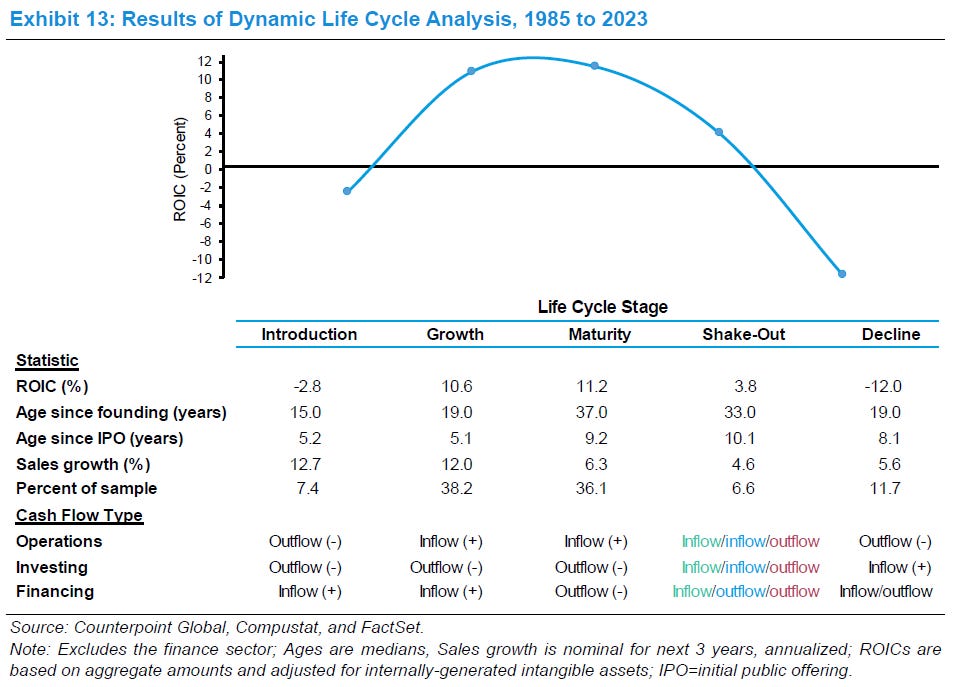
In this chart, you see ROIC peaking in the growth and maturity stages, then tapering off in shake-out and plunging into negative territory in decline. It’s essentially the textbook curve investors expect, but with some revealing details underneath.
Look closer at the accompanying table:
In the Introduction stage, ROIC is predictably negative (-2.8%), with companies typically around 15 years old since founding, 5 years post-IPO, and still growing sales at 12.7%.
In the Growth stage, ROIC jumps to 10.6% with sustained double-digit sales growth.
Interestingly, Maturity maintains a slightly higher ROIC at 11.2%, though sales growth moderates to 6.3%.
As companies hit Shake-Out, ROIC falls to 3.8% and sales growth slows to 4.6%.
By Decline, ROIC plunges to -12.0%, with most firms now about 19 years old (median) and sales growth surprisingly ticking up slightly, likely due to cost-cutting or one-off restructuring events.
What’s fascinating is that this model finally captures the life cycle we’d expect, but using a dynamic cash-flow-based approach, rather than static age-based assumptions.
Also worth noting: roughly three-quarters of public companies fall into the Growth or Maturity stages at any given time, which makes sense in an environment where the public markets have become dominated by large, well-established firms.
What I’m Taking Away From This
For me, the biggest lesson is the importance of moving beyond simplistic heuristics. Relying on age or IPO vintage to guess a company’s life cycle stage is lazy thinking and misleading. Cash flow-based classifications offer a far more accurate, dynamic picture.
It also reinforced something I’ve believed for a long time: high growth is desirable, but sustainable value creation requires strong ROIC combined with moderate, defensible growth. The companies that pull this off are rare, and they deserve a premium.
I’m already thinking about integrating these insights into my investment process, perhaps by screening for firms whose operating cash flow patterns match those of growth-stage companies and combining them with Peter Lynch’s criteria for growth stocks.
If nothing else, this exercise reminded me why it’s worth revisiting even the most foundational ideas in investing. The frameworks we rely on should be living documents that are questioned, tested, and revised in light of new evidence.
This one certainly was.